Markets
The U.S. Banks With the Highest Exposure to Commercial Real Estate
![]() See this visualization first on the Voronoi app.
See this visualization first on the Voronoi app.
U.S. Banks With the Most Commercial Real Estate Exposure
This was originally posted on our Voronoi app. Download the app for free on iOS or Android and discover incredible data-driven charts from a variety of trusted sources.
Today, there is roughly $5.7 trillion in commercial real estate debt outstanding—with U.S. banks holding approximately half of this total on their balance sheets.
The commercial property sector, which includes office, retail, healthcare, and multi-family properties, has faced mounting pressures amid high interest rates and lower occupancy levels. Given these headwinds, it poses the risk of higher defaults and steep loan losses in a sector that has not fully recovered since the collapse of Silicon Valley Bank last year.
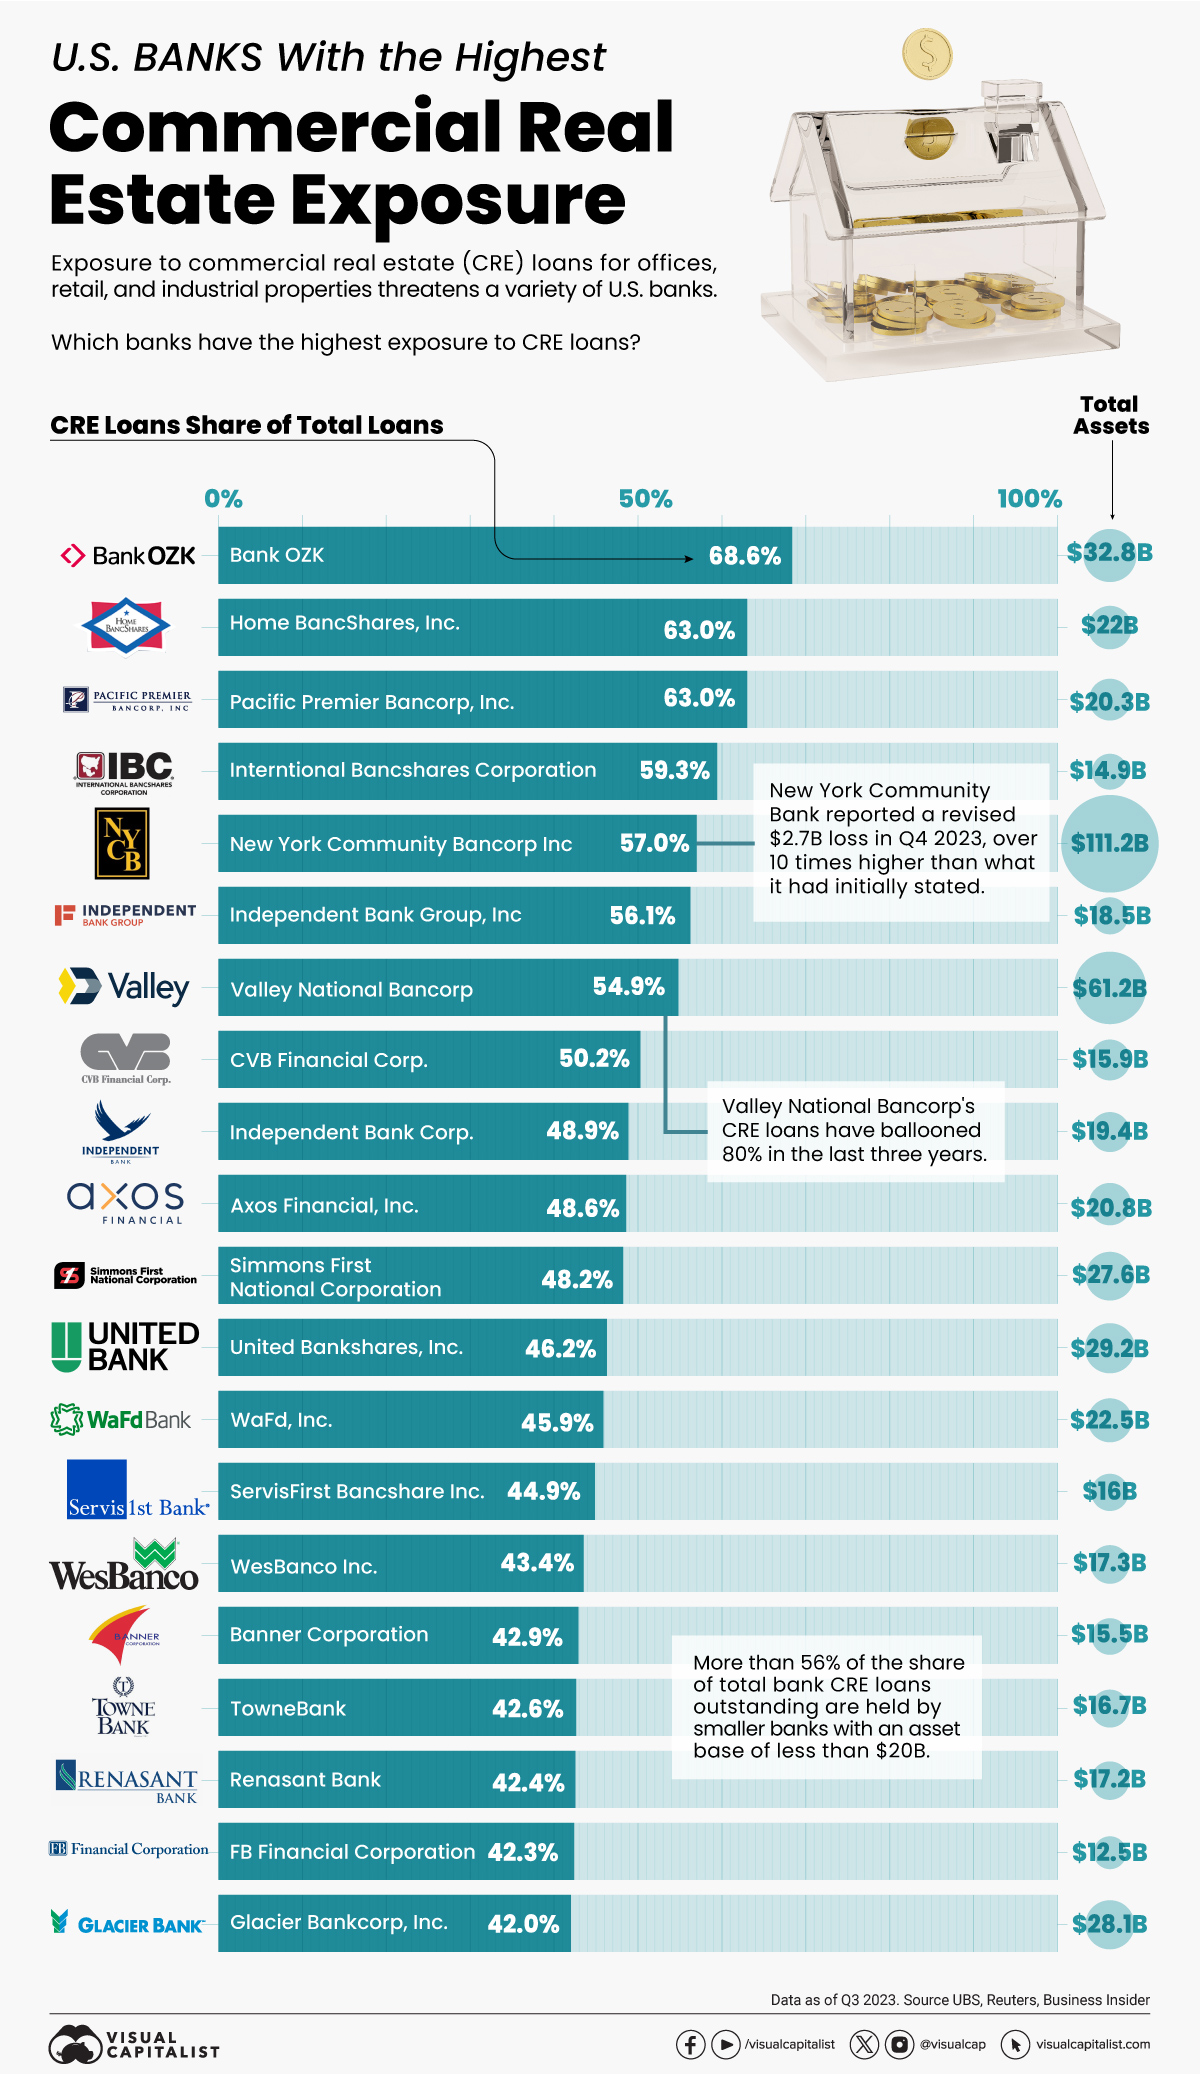
This graphic shows the U.S. banks with the highest exposure to the commercial real estate sector, based on analysis from UBS.
Top U.S. Banks, by Share of Commercial Property Loans
Here are the banks with the greatest concentration of commercial property loans as of the third quarter of 2023:
| Bank | Commercial Real Estate Share of Total Loans | Total Commercial Real Estate Loans | Total Assets |
|---|---|---|---|
| Bank OZK | 68.6% | $17.4B | $32.8B |
| Home BancShares, Inc. | 63.0% | $9.0B | $22.0B |
| Pacific Premier Bancorp, Inc. | 63.0% | $8.4B | $20.3B |
| International Bancshares Corporation | 59.3% | $4.7B | $14.9B |
| New York Community Bancorp Inc | 57.0% | $49.0B | $111.2B |
| Independent Bank Group, Inc. | 56.1% | $8.0B | $18.5B |
| Valley National Bancorp | 54.9% | $27.5B | $61.2B |
| CVB Financial Corp. | 50.2% | $4.5B | $15.9B |
| Independent Bank Corp. | 48.9% | $7.0B | $19.4B |
| Axos Financial, Inc. | 48.6% | $8.3B | $20.8B |
| Simmons First National Corporation Class A | 48.2% | $8.1B | $27.6B |
| United Bankshares, Inc. | 46.2% | $9.8B | $29.2B |
| WaFd, Inc. | 45.9% | $8.1B | $22.5B |
| ServisFirst Bancshares Inc | 44.9% | $5.2B | $16.0B |
| WesBanco, Inc. | 43.4% | $4.9B | $17.3B |
| Banner Corporation | 42.9% | $4.6B | $15.5B |
| TowneBank | 42.6% | $4.8B | $16.7B |
| Renasant Corporation | 42.4% | $5.3B | $17.2B |
| FB Financial Corporation | 42.3% | $4.0B | $12.5B |
| Glacier Bancorp, Inc. | 42.0% | $6.8B | $28.1B |
As the above table shows, the vast majority of banks with the greatest exposure are small and medium-sized financial institutions.
Bank OZK, based in Arkansas, has the highest proportion of commercial property loans, at 68.6% of total loans. As one of the country’s most prominent lenders to Manhattan property developers, its share price has outperformed the S&P 500 by tenfold since going public 27 years ago.
New York Community Bancorp, the only big bank on the list, has $49 billion in commercial property loans, making up 57% of its overall loans. At the height of regional banking turmoil last year, one of New York Community Bancorp’s subsidiaries took over the failed Signature Bank in a multi-billion dollar deal.
Since the bank reported $2.7 billion in losses in the fourth quarter of 2023, its share price has plummeted roughly 68%. The surprise loss—which was revised from $252 million—prompted the bank to seek a $1 billion lifeline from investors to help shore up confidence in the institution. Former U.S. Treasury Secretary Steven Mnunchin was a major investor in the deal.
Like New York Community Bancorp, a number of other regional banks have seen their share prices lag due to its fallout.
Commercial Property Debt Concentrated in Small Banks
Below, we show how the majority of commercial real estate loans are found in small U.S. banks, which are those with assets of $20 billion and under:
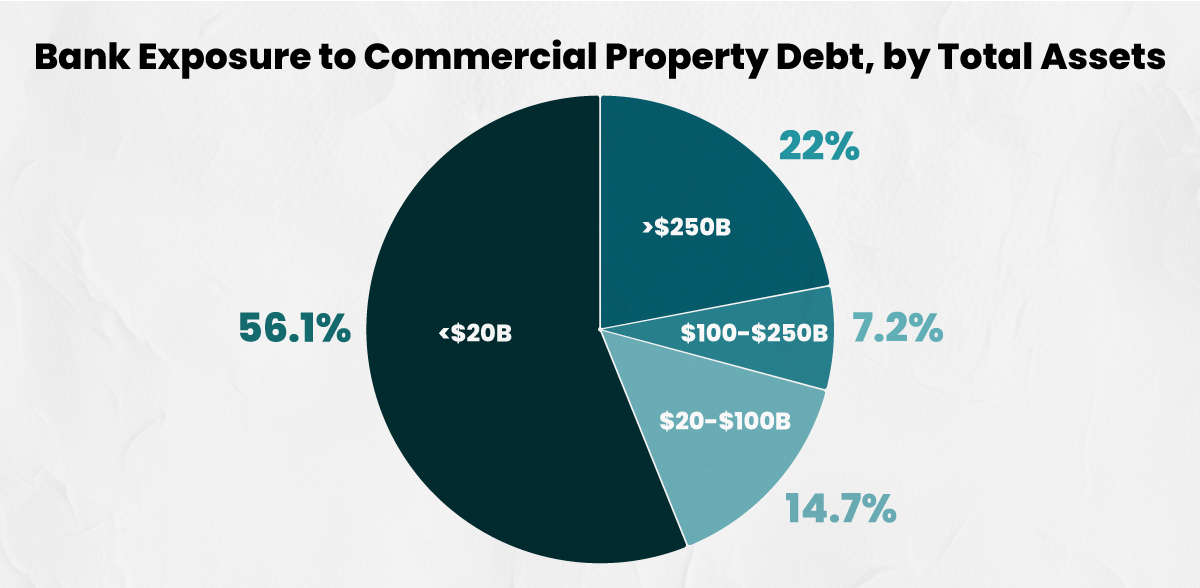
With 56.1% of all commercial property loans, small U.S. banks face the highest risk compared to other bigger banks.
Given the high share of loans, banks may run the risk of failure especially if credit losses accelerate and valuations decline. At the same time, it could be more challenging to refinance debt as valuations deteriorate.
While these troubles have begun to emerge over the last year, there is also the likelihood that losses could continue over the next several years. In fact, after the global financial crisis, credit losses peaked two years after delinquencies hit their highest point.


Markets
Visualizing Global Inflation Forecasts (2024-2026)
Here are IMF forecasts for global inflation rates up to 2026, highlighting a slow descent of price pressures amid resilient global growth.


Visualizing Global Inflation Forecasts (2024-2026)
Global inflation rates are gradually descending, but progress has been slow.
Today, the big question is if inflation will decline far enough to trigger easing monetary policy. So far, the Federal Reserve has held rates for nine months amid stronger than expected core inflation, which excludes volatile energy and food prices.
Yet looking further ahead, inflation forecasts from the International Monetary Fund (IMF) suggest that inflation will decline as price pressures ease, but the path of disinflation is not without its unknown risks.
This graphic shows global inflation forecasts, based on data from the April 2024 IMF World Economic Outlook.
Get the Key Insights of the IMF’s World Economic Outlook
Want a visual breakdown of the insights from the IMF’s 2024 World Economic Outlook report?
This visual is part of a special dispatch of the key takeaways exclusively for VC+ members.
Get the full dispatch of charts by signing up to VC+.
The IMF’s Inflation Outlook
Below, we show the IMF’s latest projections for global inflation rates through to 2026:
| Year | Global Inflation Rate (%) | Advanced Economies Inflation Rate (%) | Emerging Market and Developing Economies Inflation Rate (%) |
|---|---|---|---|
| 2019 | 3.5 | 1.4 | 5.1 |
| 2020 | 3.2 | 0.7 | 5.2 |
| 2021 | 4.7 | 3.1 | 5.9 |
| 2022 | 8.7 | 7.3 | 9.8 |
| 2023 | 6.8 | 4.6 | 8.3 |
| 2024 | 5.9 | 2.6 | 8.3 |
| 2025 | 4.5 | 2.0 | 6.2 |
| 2026 | 3.7 | 2.0 | 4.9 |
After hitting a peak of 8.7% in 2022, global inflation is projected to fall to 5.9% in 2024, reflecting promising inflation trends amid resilient global growth.
While inflation has largely declined due to falling energy and goods prices, persistently high services inflation poses challenges to mitigating price pressures. In addition, the IMF highlights the potential risk of an escalating conflict in the Middle East, which could lead to energy price shocks and higher shipping costs.
These developments could negatively affect inflation scenarios and prompt central banks to adopt tighter monetary policies. Overall, by 2026, global inflation is anticipated to decline to 3.7%—still notably above the 2% target set by several major economies.
Adding to this, we can see divergences in the path of inflation between advanced and emerging economies. While affluent nations are forecast to see inflation edge closer to the 2% target by 2026, emerging economies are projected to have inflation rates reach 4.9%—falling closer to their pre-pandemic averages.
Get the Full Analysis of the IMF’s Outlook on VC+
This visual is part of an exclusive special dispatch for VC+ members which breaks down the key takeaways from the IMF’s 2024 World Economic Outlook.
For the full set of charts and analysis, sign up for VC+.

-

 Culture6 days ago
The World’s Top Media Franchises by All-Time Revenue
-

 Science2 weeks ago
Visualizing the Average Lifespans of Mammals
-

 Brands2 weeks ago
How Tech Logos Have Evolved Over Time
-

 Energy2 weeks ago
Ranked: The Top 10 EV Battery Manufacturers in 2023
-

 Countries2 weeks ago
Countries With the Largest Happiness Gains Since 2010
-

 Economy2 weeks ago
VC+: Get Our Key Takeaways From the IMF’s World Economic Outlook
-

 Demographics1 week ago
The Countries That Have Become Sadder Since 2010
-

 Money1 week ago
Charted: Who Has Savings in This Economy?