

Real Assets
Visualizing the Assets and Liabilities of U.S. Banks


Understanding the Assets and Liabilities of U.S. Banks
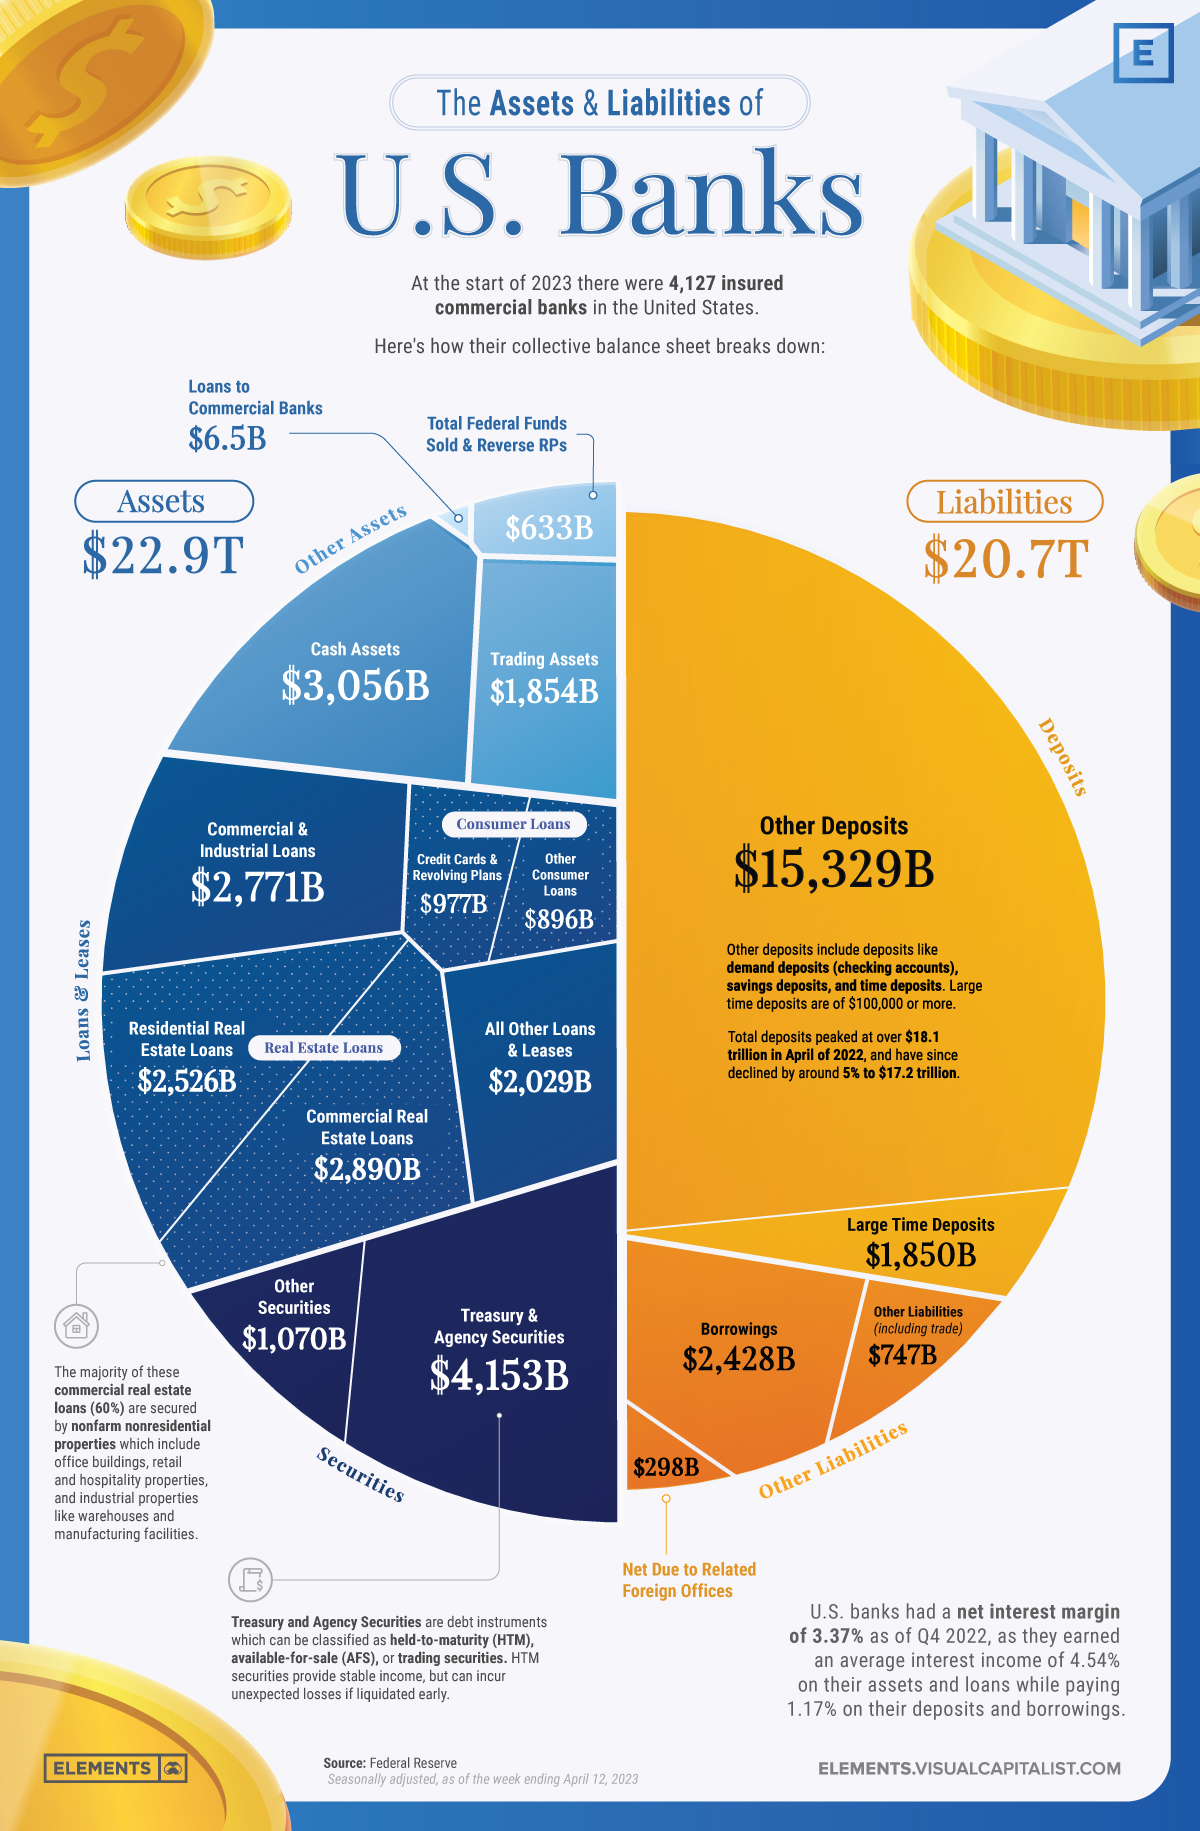
The U.S. banking sector has more than 4,000 FDIC-insured banks that play a crucial role in the country’s economy by securely storing deposits and providing credit in the form of loans.
This infographic visualizes all of the deposits, loans, and other assets and liabilities that make up the collective balance sheet of U.S banks using data from the Federal Reserve.
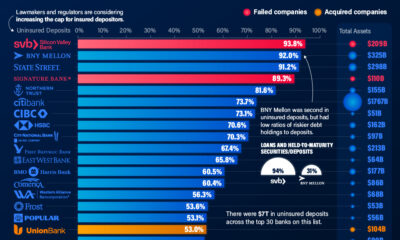
With the spotlight on the banking sector after the collapses of Signature Bank, Silicon Valley Bank, and First Republic bank, understanding the assets and liabilities that make up banks’ balance sheets can give insight in how they operate and why they sometimes fail.
Assets: The Building Blocks of Banks’ Business
Assets are the foundation of a bank’s operations, serving as a base to provide loans and credit while also generating income.
A healthy asset portfolio with a mix of loans along with long-dated and short-dated securities is essential for a bank’s financial stability, especially since assets not marked to market may have a lower value than expected if liquidated early.
As of Q4 2022, U.S. banks generated an average interest income of 4.54% on all assets.
Loans and Leases
Loans and leases are the primary income-generating assets for banks, making up 53% of the assets held by U.S. banks.
These include:
- Real estate loans for residential and commercial properties (45% of all loans and leases)
- Commercial and industrial loans for business operations (23% of all loans and leases)
- Consumer loans for personal needs like credit cards and auto loans (15% of all loans and leases)
- Various other kinds of credit (17% of all loans and leases)
Securities
Securities make up the next largest portion of U.S. banks’ assets (23%) at $5.2 trillion. Banks primarily invest in Treasury and agency securities, which are debt instruments issued by the U.S. government and its agencies.
These securities can be categorized into three types:
- Held-to-maturity (HTM) securities, which are held until they mature and provide a stable income stream
- Available-for-sale (AFS) securities, which can be sold before maturity
- Trading securities, held for short-term trading to profit from price fluctuations
Along with Treasury and agency securities which make up the significant majority (80%) of U.S. banks’ securities, banks also invest in other securities which are non-government-issued debt instruments like corporate bonds, mortgage-backed securities, and asset-backed securities.
Cash Assets
Cash assets are a small but essential part of U.S. banks’ balance sheets, making up $3.1 trillion or 13% of all assets. Having enough cash assets ensures adequate liquidity needed to meet short-term obligations and regulatory requirements.
Cash assets include physical currency held in bank vaults, pending collections, and cash balances in accounts with other banks.
Liabilities: Banks’ Financial Obligations
Liabilities represent the obligations banks must fulfill, including customer deposits and borrowings. Careful management of liabilities is essential to maintain liquidity, manage risk, and ensure a bank’s overall solvency.
Deposits
Deposits make up the largest portion of banks’ liabilities as they represent the money that customers entrust to these institutions. It’s important to note that the FDIC insures deposit accounts up to $250,000 per depositor, per insured bank, for each type of account (like single accounts, joint accounts, and retirement accounts).
There are two primary types of deposits, large time deposits and other deposits. Large time deposits are defined by the FDIC as time deposits exceeding $100,000, while other deposits include checking accounts, savings accounts, and smaller time deposits.
U.S. banks had $17.18 trillion in overall deposits as of April 12th 2023, with other deposits accounting for 74% of the overall liabilities while large time deposits made up 9%.
Borrowings
After deposits, borrowings are the next largest liability on the balance sheet of U.S. banks, making up nearly 12% of all liabilities at $2.4 trillion.
These include short-term borrowings from other banks or financial institutions such as Federal Funds and repurchase agreements, along with long-term borrowings like subordinated debt which ranks below other loans and securities in the event of a default.
How Deposits, Rates, and Balance Sheets Affect Bank Failures
Just like any other business, banks have to balance their finances to remain solvent; however, successful banking also relies heavily on the trust of depositors.
While in other businesses an erosion of trust with customers might lead to breakdowns in future business deals and revenues, only in banking can a dissolution in customer trust swiftly turn into the immediate removal of deposits that backstop all revenue-generating opportunities.
Although recent bank collapses aren’t solely due to depositors withdrawing funds, bank runs have played a significant role. Most recently, in First Republic’s case, depositors pulled out more than $101 billion in Q1 of 2023, which would’ve been more than 50% of their total deposits, had some of America’s largest banks not injected $30 billion in deposits on March 16th.
It’s important to remember that the rapidly spreading fires of bank runs are initially sparked by poor asset management, which can sometimes be detected on banks’ balance sheets.
A combination of excessive investment in long-dated held-to-maturity securities, one of the fastest rate hiking cycles in recent history, and many depositors fearing for and moving their uninsured deposits of over $250,000 has resulted in the worst year ever for bank failures in terms of total assets.


Real Assets
Visualizing Global Gold Production in 2023
Gold production in 2023 was led by China, Australia, and Russia, with each outputting over 300 tonnes.

Visualizing Global Gold Production in 2023
This was originally posted on our Voronoi app. Download the app for free on iOS or Android and discover incredible data-driven charts from a variety of trusted sources.
Over 3,000 tonnes of gold were produced globally in 2023.
In this graphic, we list the world’s leading countries in terms of gold production. These figures come from the latest USGS publication on gold statistics (published January 2024).
China, Australia, and Russia Produced the Most Gold in 2023
China was the top producer in 2023, responsible for over 12% of total global production, followed by Australia and Russia.
| Country | Region | 2023E Production (tonnes) |
|---|---|---|
| 🇨🇳 China | Asia | 370 |
| 🇦🇺 Australia | Oceania | 310 |
| 🇷🇺 Russia | Europe | 310 |
| 🇨🇦 Canada | North America | 200 |
| 🇺🇸 United States | North America | 170 |
| 🇰🇿 Kazakhstan | Asia | 130 |
| 🇲🇽 Mexico | North America | 120 |
| 🇮🇩 Indonesia | Asia | 110 |
| 🇿🇦 South Africa | Africa | 100 |
| 🇺🇿 Uzbekistan | Asia | 100 |
| 🇬🇭 Ghana | Africa | 90 |
| 🇵🇪 Peru | South America | 90 |
| 🇧🇷 Brazil | South America | 60 |
| 🇧🇫 Burkina Faso | Africa | 60 |
| 🇲🇱 Mali | Africa | 60 |
| 🇹🇿 Tanzania | Africa | 60 |
| 🌍 Rest of World | - | 700 |
Gold mines in China are primarily concentrated in eastern provinces such as Shandong, Henan, Fujian, and Liaoning. As of January 2024, China’s gold mine reserves stand at an estimated 3,000 tonnes, representing around 5% of the global total of 59,000 tonnes.
In addition to being the top producer, China emerged as the largest buyer of the yellow metal for the year. In fact, the country’s central bank alone bought 225 tonnes of gold in 2023, according the World Gold Council.
Estimated Global Gold Consumption
Most of the gold produced in 2023 was used in jewelry production, while another significant portion was sold as a store of value, such as in gold bars or coins.
- Jewelry: 46%
- Central Banks and Institutions: 23%
- Physical Bars: 16%
- Official Coins, Medals, and Imitation Coins: 9%
- Electrical and Electronics: 5%
- Other: 1%
According to Fitch Solutions, over the medium term (2023-2032), global gold mine production is expected to grow 15%, as high prices encourage investment and output.
Real Assets
Charted: The Value Gap Between the Gold Price and Gold Miners
While gold prices hit all-time highs, gold mining stocks have lagged far behind.

Gold Price vs. Gold Mining Stocks
This was originally posted on our Voronoi app. Download the app for free on Apple or Android and discover incredible data-driven charts from a variety of trusted sources.
Although the price of gold has reached new record highs in 2024, gold miners are still far from their 2011 peaks.
In this graphic, we illustrate the evolution of gold prices since 2000 compared to the NYSE Arca Gold BUGS Index (HUI), which consists of the largest and most widely held public gold production companies. The data was compiled by Incrementum AG.
Mining Stocks Lag Far Behind
In April 2024, gold reached a new record high as Federal Reserve Chair Jerome Powell signaled policymakers may delay interest rate cuts until clearer signs of declining inflation materialize.
Additionally, with elections occurring in more than 60 countries in 2024 and ongoing conflicts in Ukraine and Gaza, central banks are continuing to buy gold to strengthen their reserves, creating momentum for the metal.
Traditionally known as a hedge against inflation and a safe haven during times of political and economic uncertainty, gold has climbed over 11% so far this year.
According to Business Insider, gold miners experienced their best performance in a year in March 2024. During that month, the gold mining sector outperformed all other U.S. industries, surpassing even the performance of semiconductor stocks.
Still, physical gold has outperformed shares of gold-mining companies over the past three years by one of the largest margins in decades.
| Year | Gold Price | NYSE Arca Gold BUGS Index (HUI) |
|---|---|---|
| 2023 | $2,062.92 | $243.31 |
| 2022 | $1,824.32 | $229.75 |
| 2021 | $1,828.60 | $258.87 |
| 2020 | $1,895.10 | $299.64 |
| 2019 | $1,523.00 | $241.94 |
| 2018 | $1,281.65 | $160.58 |
| 2017 | $1,296.50 | $192.31 |
| 2016 | $1,151.70 | $182.31 |
| 2015 | $1,060.20 | $111.18 |
| 2014 | $1,199.25 | $164.03 |
| 2013 | $1,201.50 | $197.70 |
| 2012 | $1,664.00 | $444.22 |
| 2011 | $1,574.50 | $498.73 |
| 2010 | $1,410.25 | $573.32 |
| 2009 | $1,104.00 | $429.91 |
| 2008 | $865.00 | $302.41 |
| 2007 | $836.50 | $409.37 |
| 2006 | $635.70 | $338.24 |
| 2005 | $513.00 | $276.90 |
| 2004 | $438.00 | $215.33 |
| 2003 | $417.25 | $242.93 |
| 2002 | $342.75 | $145.12 |
| 2001 | $276.50 | $65.20 |
| 2000 | $272.65 | $40.97 |
Among the largest companies on the NYSE Arca Gold BUGS Index, Colorado-based Newmont has experienced a 24% drop in its share price over the past year. Similarly, Canadian Barrick Gold also saw a decline of 6.5% over the past 12 months.

-

 Electrification3 years ago
Ranked: The Top 10 EV Battery Manufacturers
-

 Electrification2 years ago
The Key Minerals in an EV Battery
-

 Real Assets3 years ago
The World’s Top 10 Gold Mining Companies
-

 Misc3 years ago
All the Metals We Mined in One Visualization
-

 Energy Shift2 years ago
What Are the Five Major Types of Renewable Energy?
-

 Electrification2 years ago
Mapped: Solar Power by Country in 2021
-

 Electrification2 years ago
The World’s Largest Nickel Mining Companies
-

 Electrification3 years ago
How Much Land is Needed to Power the U.S. with Solar?